POCUS Physics

Don't worry, there won't be equations!
Physics is a little bit important; knowledge of potential for imaging artefacts is hugely important.
A huge thanks to Dr Zoltan Molnar for his help with this section. Much of the content on this page is based on Dr Molnar's contribution to a 2018 review article on neonatal ultrasound:

Why Physics?
Physics is a little bit important; knowledge of potential for imaging artefacts is hugely important.
A huge thanks to Dr Zoltan Molnar for his help with this section. Much of the content on this page is based on Dr Molnar's contribution to a 2018 review article on neonatal ultrasound:

Why Physics?
We realise that the last thing people want to do before they get to start scanning is to read about physics. But the problem is that if you just look at images on a screen you can be fooled into thinking that you are seeing inside the body. You aren't, you're just seeing sound waves bouncing around. And sure, sometimes they bounce off a real structure and show you real anatomy, but sometimes they mislead you. So we're just going to cover the bacis here, with a focus on artefact recognition.
After that if you want to get into more detail than that there are references at the bottom of the page.
Sound Waves
There are a few things we need to know about sound waves to understand how they behave when we transmit them into the body.
• Wavelength - the distance between two points of the same phase. If we were looking at waves on the ocean this would be the distance between the peaks of two waves.
• Frequency - the number of cycles per second, measured in Hertz (Hz). In our ocean analogy this is the number of waves passing by a point in a single second.
• Velocity - the speed at which the eave propagates through a medium measured in metres/second.
• Amplitude - the maximum particle displacement, measured in Decibels (dB). Or the height of the ocean wave.
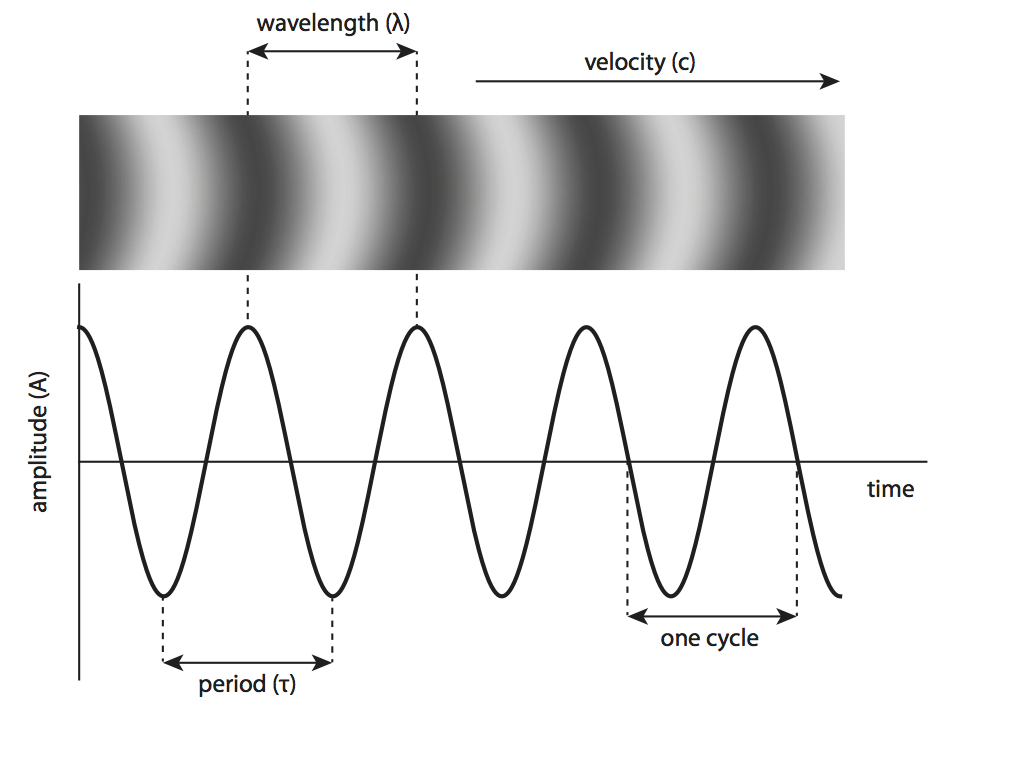
Parameters of a sound wave. Image courtesy of Dr Zoltan Molnar
Velocity in turn depends on the characteristics of the tissue that the sound is passing through, specifically the density and stiffness of the tissue. Sound travels through most tissues in the body at around 1,500metres/second, with slight differences in different tissues.
Why are we making such a big deal about this? Because the key issue here is that so far we have only talked about sound traveling through tissues, but to visualize anything with ultrasound we need sound to be reflected off a tissue and back to the ultrasound probe. When does sound get reflected? When it meets tissues with different density and stiffness characteristics. This is the whole basis of medical ultrasound.
More on this shortly, but for now it'll suffice to say that the greater the difference between two tissues, the more sound will be reflected back at the junction between the two tissues. The most extreme example of this is when ultrasound tries to travel between tissue and air. The density and stiffness of air are clearly very different from the density and stiffness of muscle or blood. The speed of sound in air is 330 metres/second (to know how far away a storm is, count the seconds between seeing the lightning and hearing the thunder, divide by 3, and that is the distance in kilometres). So if we try to ultrasound through air we can't see anything because all the waves are reflected back at the border between the tissue and the air. Thats why its s0 hard to get good views in babies with hyperinflated lungs, and why microbubbles in the circulation are so easy to see.
You'll likely already have worked out that the wavelength and frequency of sound must be inter-related, and that if you change one you must also change the other (since the velocity of sound in any tissue is constant). The frequency of sound is inversely related to wavelength. As frequency goes up wavelength goes down.
We're going to talk more about how sound waves interact with tissues in a moment, and in particular why clinicians need to know why high frequency probes are good for some scanning modes while low frequency are better for others. But first a word on how ultrasound probes create sound waves, and on why some probes are better for certain indications
Generation of ultrasound
In the imaging setting ultrasound waves are generated by transducers equipped with piezoelectric crystals. These crystals change shape when electric currents are applied through them. But this process also happens in reverse - when crystals are deformed by mechanical pressure they generate electric signals.
Individual crystals are located adjacent to each other in an ‘array’ and are connected electrically. Applying rapid alternating current to the crystals generates vibration and ultrasound emission. This ‘transmission phase’ is very brief (0.5 – 3 microseconds) and is followed by a ‘receiver phase’ in which returning sound waves compress the piezoelectric crystals and generate electric signals. This phase is much longer (up to 1 millisecond) than the transmission phase since echoes from a range of depths must be detected. The combined durations of the transmission and receiver phases is the pulse repetition period.
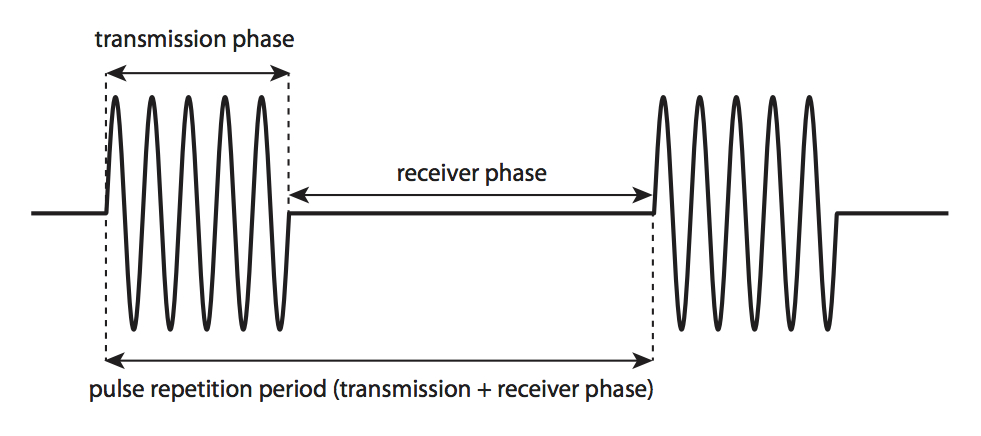
Pulse duration and pulse repetition period. Adapted from Rovner A. The principle of ultrasound—ECHOpedia 2017.
A shallower depth allows for a shortened receiver phase and therefore a shorter pulse repetition period and a higher frame rate.
Types of Ultrasound Probes
Ultrasound probes are available in a variety of types of array.
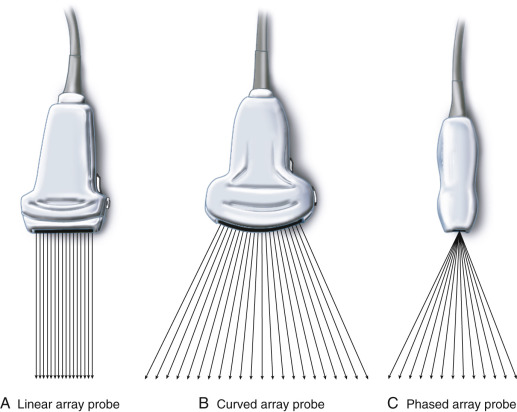
Adapted from Karmakar et al. Ultrasound-Guided Regional Anesthesia. https://www.sciencedirect.com/topics/nursing-and-health-professions/transducer
In echocardiography a phased array transducer is generally used because of its small footprint, allowing imaging through small intercostal windows. Phased array probes can be steered and focused to further optimise imaging.
Some vascular applications favour a linear array for maximal spatial resolution. However linear probes generally have two main disadvantages:
- they have a relatively long transmission phase, which results in low frame rate
- they require good imaging wondows, if there is any overlying lung the view will be very impaired. In contrast sect0r probes can focus their beams through a narrower gap between the lungs.
Small curved array probes are useful for cranial ultrasound imaging as they have both a small footprint but a wide field of view.
Interaction of Ultrasound with Tissues
Interactions between emitted ultrasound waves and tissues are what produce the images. These interactions may be of different types, an awareness of which is key to understanding common image artefacts
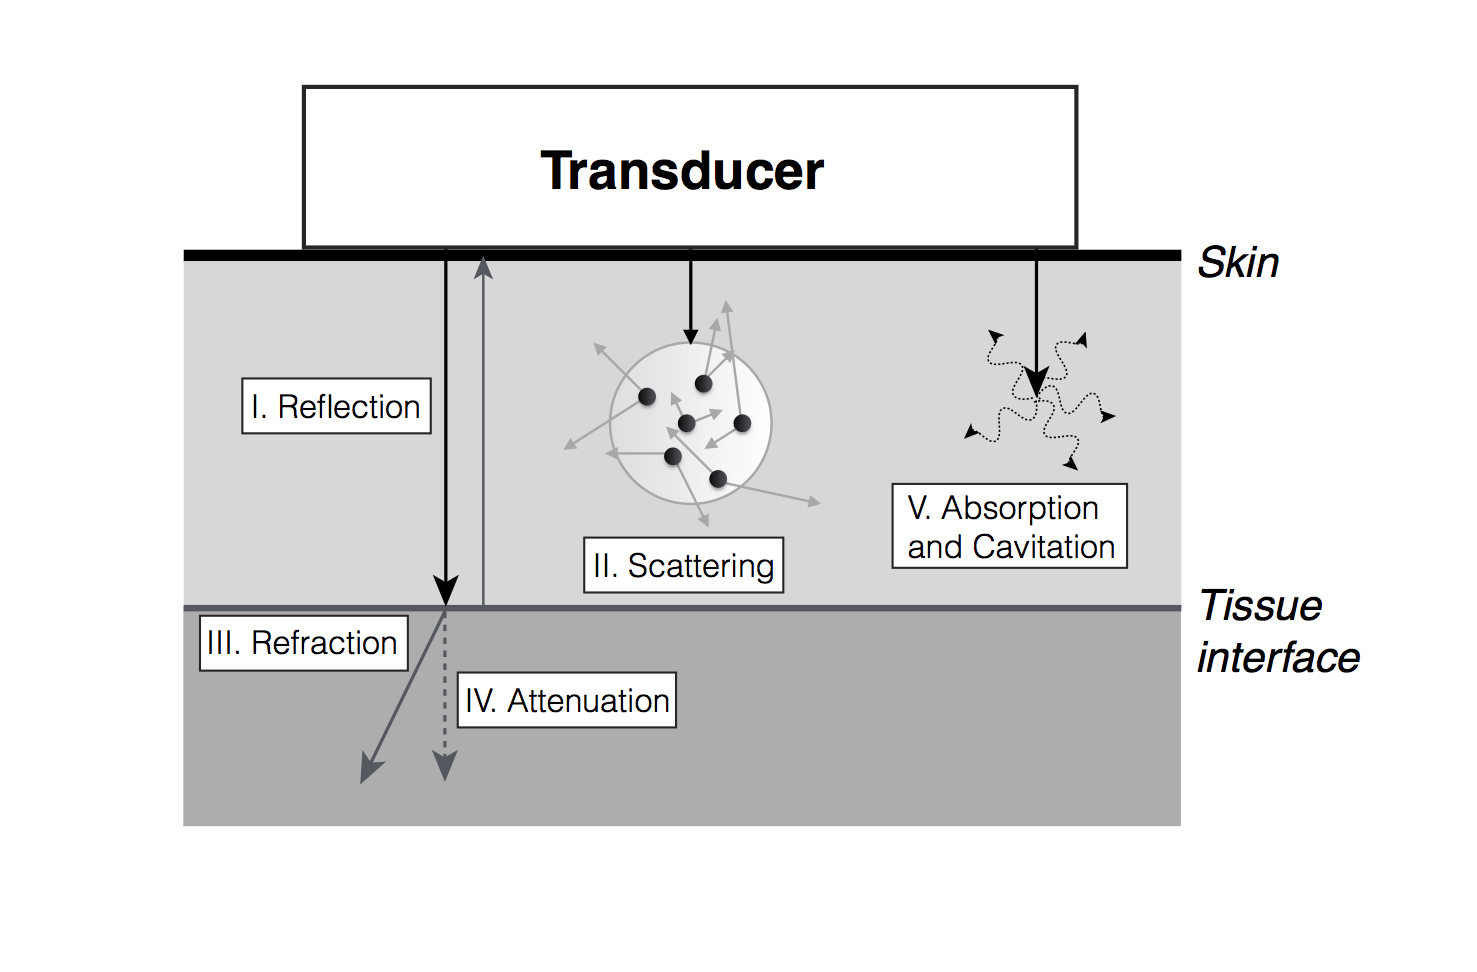
Ultrasound and tissue interactions. Adapted from Textbook of Clinical Echocardiography, 5th Edition, Catherine Otto, “Principles of Echocardiographic Image Acquisition and Doppler Analysis,” Fig. 1.4, page 5, Copyright (2013), with permission from Elsevier
i. Reflection
When an ultrasound beam hits a boundary/interface between two different tissues, part of the ultrasound is reflected back to the probe. The amount of reflection depends on the difference in the properties of the two tissues, as discussed above. The more different the densities of the tissues the more strong the reflection. The magnitude of returning reflection is also influenced by the angle between the tissue border and the ultrasound beam. Maximal reflection is obtained when tissue border is perpendicular to the ultrasound beam. This explains why, when imaging the heart from an apical four chamber view, that there can appear to be a ventricular septal defect in the region of the membranous septum - there is very little reflection from a structure that is almost in line with the ultrasound beam. Hence the ventricular septum should be interrogated from a subcostal or parasternal view, where the septum is orthogonal to the beam. See example images in the 'Normal Structure' page.
ii. Scattering
When an ultrasound beam meets a boundary consisting of small structures (smaller than the wavelength of the sound) the ultrasound beam is scattered. This results in reflection of the beam to all directions and a disorganised returning signal. Most of the signal is lost due to the scattering in multiple directions. Nonetheless, backscattering plays an important role in generating the eventual 2D image and most organs have a characteristic scatter signature owing to their specific structures. Hyperechoic (bright) regions within an organ usually represent increased scattering.
iii. Refraction
Refraction refers to the bending of the ultrasound beam when it enters a medium where its propagation speed is different (as is seen when looking at an object below the surface of water). The degree of bending depends on the angle between the beam and the surface (angle of insonation), and the degree of difference in propagation speeds between tissues. Refraction artefact may cause objects to appear in altered locations.
iv. Attenuation
As ultrasound travels within tissues, part of the energy is lost to absorption and scattering. This results in weaker signal intensity from structures that are farther from the probe. The higher the frequency the greater the attenuation, and therefore the lower the penetration. Modern scanners use automatic ‘time gain compensation’ to ameliorate this problem.
v. Absorption and Cavitation
Absorption of ultrasound by human tissues is the process of energy loss by conversion to heat. Cavitation occurs when microbubbles are formed due to high-energy ultrasound interaction. All clinical ultrasound systems work within carefully controlled energy settings, such as those set by the US Food and Drugs Administration, and ultrasound imaging is not considered to have any biologic ill effects. Since all imaging introduces energy into the body however, imaging power and duration of scans should be kept to a minimum.
Image production
Returning ultrasound signal leads to compression of the piezoelectric crystals and is converted to an electric signal and processed to produce an image on the screen. In B-mode (Brightness mode) a two-dimensional image is produced which is a representation of an anatomic slice of tissue. In M-mode (Motion mode), one dedicated scan line is used to detect rapidly moving structures. This form of imaging provides the highest temporal and spatial resolution. In harmonic imaging the scanner receives only the second harmonic component of the original signal. These harmonic components are generated as the original wave propagates in tissues. Harmonic imaging is widely used in adult echocardiography, as it results in better signal-to-noise ratio. As it has poorer axial resolution it is not always beneficial in newborns.
Resolution
Resolution of ultrasound imaging includes both spatial and temporal resolution. Spatial resolution is further divided into axial, lateral and elevational resolution.
Axial Resolution
Axial resolution is the ability to differentiate structures that are aligned along the imaging beam. Axial resolution is determined by spatial pulse length (SPL), which is the product of wavelength and the number of cycles in one pulse. The lower the SPL, the higher the resolution. Increasing the frequency decreases the wavelength, therefore yielding better resolution. Typical axial resolution is 0.5 mm at a transmitting frequency of 5 MHz and 0.25 mm at 10 MHz.
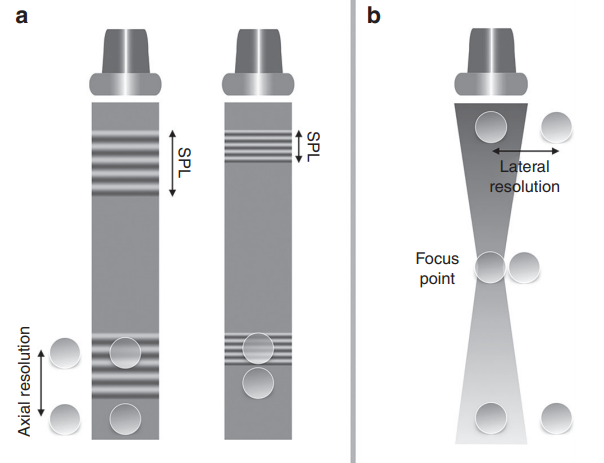
Axial (left panel) and lateral (right panel) resolution. Adapted from Rovner A. The principle of ultrasound—ECHOpedia 2017. Available from: http://www.echopedia.org/wiki/The_principle_of_ultrasound
Lateral Resolution
Lateral resolution is the ability to discriminate objects located in an axis perpendicular to the ultrasound beam. The major determinant of lateral resolution is beam width. Focusing the transmitted beam by applying the electric current to the individual piezoelectric crystals with time delay decreases the width of the beam at the focal point, thereby improving lateral resolution. The focus position can be set by the operator and is one of the key steps in image optimisation. Multiple focal points yield more homogenously distributed lateral resolution in the 2D image, but comes at the expense of a decrease in frame rate. Lateral resolution is best at shallow depths and narrow beams and poorest with deeper imaging and wider beams.
Temporal Resolution
Temporal resolution, the ability to detect that an object has moved over time is described in terms of frame rate, in Hz or frames/second. Frame rate depends on the time taken to create a single image line, and the number of lines that form each image. Frame rate can therefore be improved by decreasing the imaging depth, narrowing the image sector width, zooming into an area of interest, reducing the number of focus points or decreasing the line density of the sector.
Artefacts
In pursuit of an accurate representation of anatomy, the ultrasound machine makes a number of assumptions about sound propagation in tissue. Artefacts are errors in image production and are normally caused by physical processes that affect the ultrasound beam. Recognising imaging artefacts is of great importance to prevent misinterpretation of echocardiograms. A key principle of all imaging is a constant awareness of the possibility of image artefacts. Artefacts can often be recognized by altering the image plane, depth or frequency. Any unusual object should be viewed from multiple directions to ensure that it is anatomic rather than artefactual.
i. Reverberation artefacts
Reverberation artefacts are generated by strong reflectors, such as the ribs or pericardium, when waves do not travel directly to and from a tissue, but have additional reflections within the tissue before returning to the echo probe. Since the echo transducer assumes that waves have taken a direct path to the tissue and back reverberation artefacts appear as multiple images behind reflectors or ‘comet tails’.
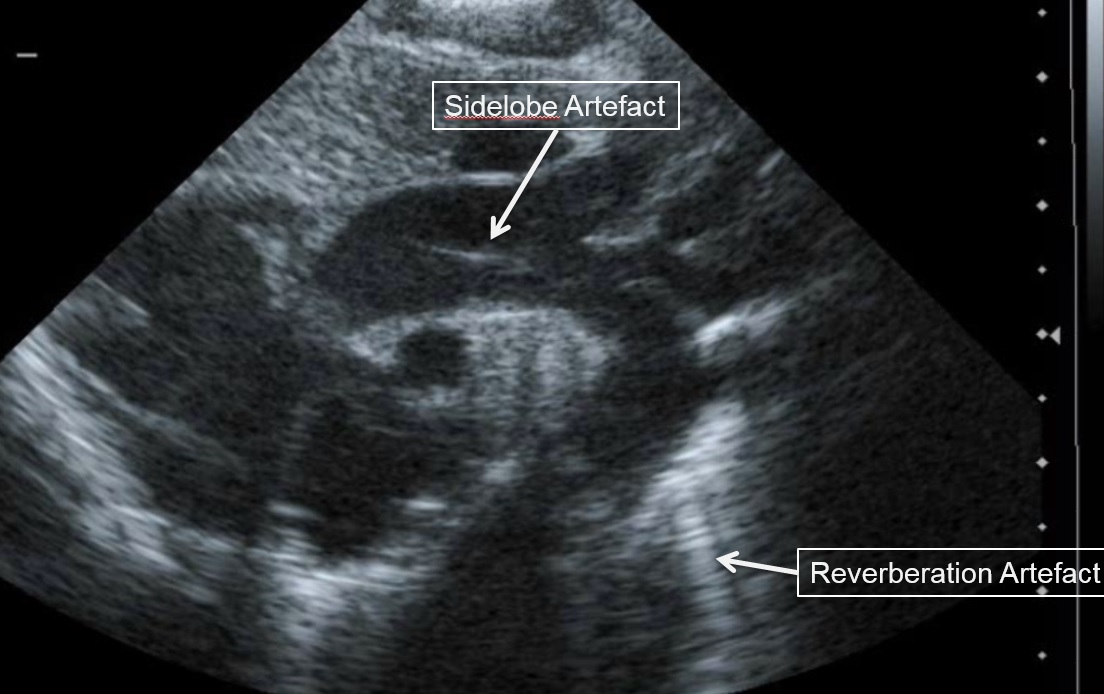
ii. Side lobe artefacts
Scanners display a 2D representation of tissue on the ultrasound screen assuming the ultrasound beam is infinitely thin. However, this is not the case and objects in front or behind the 2D plane being imaged can also appear in the main image if a very strong reflector is encountered. Since ultrasound energy is focused at the center of the image field the reflections from objects in front of or behind the imaging plane often appear faint (see above).
iii. Shadowing
Shadowing occurs when a strong reflector has already transmitted most of the emitted sound waves back to the transducer, leaving minimal residual waves to reflect on deeper objects.
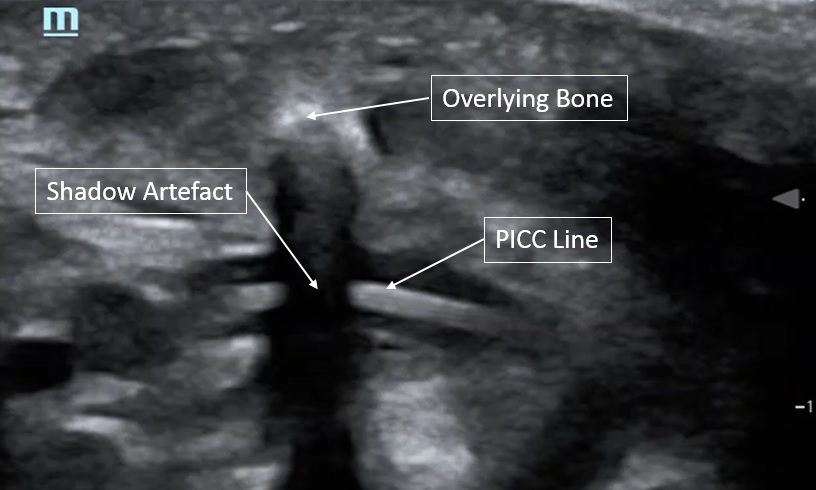
iv. Mirror imaging
Mirror imaging appears as a display of two images, one real and one artefact, due to the sound beam interacting with a strong reflector. The surface acts as mirror and reflects the pulse to another tissue interface and the ultrasound system believes the second interface is beyond the first surface, and this is where it appears on the scan. The artefact is always deeper than the true anatomy and the distance between the mirror and the real anatomy verse the artefact are equal distance.
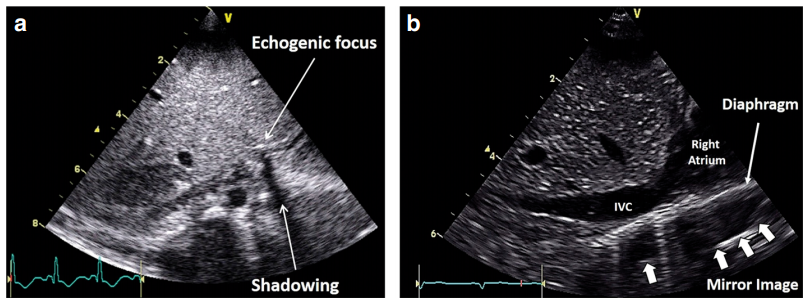
v. Beam Width Artefacts
Beam Width Artefacts occur when a poorly focused ultrasound beam is wider than the reflector being imaged. As the echogenicity of the reflector will be averaged with the adjacent normal tissue, subtle solid lesions might disappear from the image or cystic lesion may appear to be solid.
Optimizing Images in Neonatal Echocardiography
The small size of the neonatal heart and its rapid rate of contraction make high spatial and temporal resolutions essential. Fortunately, the lack of need for deep tissue penetration allows use of high frequency probes and high frame rates. Spatial and temporal resolutions are competing entities: obtaining high resolution images takes longer, therefore decreasing temporal resolution. Key steps of image optimization in neonates include:
• Use the highest transducer frequency available that provides adequate penetration, generally 8 – 12 MHz.
• Increase temporal resolution by narrowing the sector width, decreasing the image depth, using zoom and using a single focus point.
• Optimize focus point and image depth for each view and region of interest
• Use fundamental imaging rather than harmonic imaging, as the latter provides poorer axial resolution.
• Adjust image gain to improve image contrast but remember that this does not change signal-to-noise ratio.
Principles of Doppler Ultrasound
The change in pitch of sound when a vehicle with a siren passes us in the street is a familiar example of the Doppler phenomenon. When travelling towards us the pitch of the sound is artificially increased as the vehicle has travelled closer to us with each sound emission, so the sound appears to have a higher frequency. Conversely when traveling away from us the frequency appears lower. In ultrasound the concepts are similar as the same shift in frequency occurs as sound is reflected off a moving object. The extent of this Doppler shift (the difference between the emitted and the received ultrasound frequencies) depends primarily on the velocity of the moving tissue and the angle of insonation between the ultrasound beam and the direction of movement. Doppler applications can be used to quantify velocity of blood flow and myocardial tissue motion.

Doppler shift and angle of insonation. Adapted from Rovner A. The principle of ultrasound—ECHOpedia 2017. Available from: http://www.echopedia.org/wiki/The_principle_of_ultrasound. f0 transmitted frequency, fR received frequency; Δf Doppler shift, ν blood velocity, cos Ø cosine of insonation angle, c ultrasound velocity in blood
The angle of insonation of the ultrasound beam has a great impact on the extent of Doppler shift, such that minimization of the angle of insonation is a key step in all approaches to Doppler measurement. In practice an angle of insonation of less than 20 degrees is considered acceptable, since this produces only a 6% reduction in velocity estimation. If necessary correction can be made for remaining angle of insonation, but at high angles this process becomes more inaccurate. If the direction of movement is orthogonal to the imaging plane no Doppler shift is produced. While higher frequency probes provide optimal spatial resolution, lower frequencies may be required to provide adequate Doppler information, especially at higher flow velocities.
Continuous-wave (CW) Doppler and Pulsed-Wave (PW) Doppler
In Continuous Wave (CW) Doppler, two separate crystals simultaneously emit and receive signal. Continuous signal transmission can detect a wide range of velocities anywhere in the line of the ultrasound beam. Unlike PW Doppler, CW Doppler has no upper limit for velocity detection.
Pulsed-Wave (PW) Doppler emits a single pulse, before pausing to detect received signals. By selecting a timeframe for receiving the data, one can measure exclusively velocities from a spatial range of interest.

Continuous-wave (CW) and pulsed-wave (PW) Doppler. Signal sampling and aliasing (see text for details). Adapted from Rovner A. The principle of ultrasound— ECHOpedia 2017. Available from: http://www.echopedia.org/wiki/The_principle_of_ultrasound
A wider range of interest (‘sample gate’) increases signal, but reduces spatial resolution. To measure a frequency shift, the sampling rate must be twice as high as the given frequency shift. Therefore, at any given sampling rate there is a highest resolvable frequency (i.e. maximal velocity which can be detected), which is called the Nyquist limit. Above this Nyquist limit signal ‘aliases’ to show an apparent opposite direction of motion. Decreasing the imaging depth to increase the sampling frequency, or decreasing the frequency of the ultrasound beam can be useful to overcome aliasing. A ‘wall thump filter’ is applied to PW imaging to remove low-velocity, high-amplitude noises arising from the myocardium, but this setting must be adjusted when low velocity flow is being sought (e.g. when looking for diastolic flow reversal in the descending aorta or venous flow).
Colour Doppler Flow Imaging
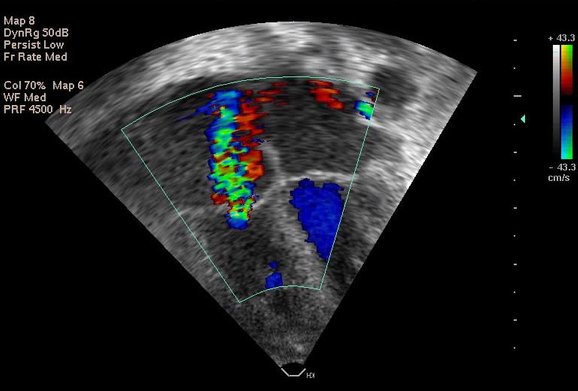
Colour Doppler is a technique for visualizing the velocity of blood within an image plane, such that local blood flow velocities are superimposed onto the corresponding B mode image. Velocities moving towards and away from the transducer are colour-coded as red or blue, respectively. High variance of velocity (turbulent flow) is encoded by adding yellow or green to the pixels, whereas aliasing at the Nyquist limit is represented by color reversal.
For computing a colour flow map PW Doppler technique is employed. Given the complexity of the calculation and the high sampling requirement, the temporal resolution of color flow imaging is typically poor. But the technique remains extremely useful for detecting shunts and blood flow in regions of interest. Using the narrowest possible sector and minimal depth helps increase frame rate. Choice of gain settings is key - accepted best practice being to increase the gain until background noise appears outside the vessels, then reducing it back until the noise is suppressed. However this approach still leaves significant variability in gain settings which may produce clinically important variability in measurements, e.g. in assessment of PDA diameter. For low-velocity signals it is important to reduce the velocity scale to enable proper visualization.
Tisue Doppler Imaging
In the same way as the Doppler effect can estimate velocity of blood motion, it can also assess velocity of myocardial motion. Doppler signal from blood flow is generally of high velocity (>10 centimetres/second). Doppler signal from myocardium is generally of lower velocity (less than 10 centimetres/second).

Bernoulli Equation and Flow Volume Calculation
A simplified version of the Bernoulli equation can be employed to estimate a pressure gradient between two points in the circulation, where pressure gradient (in mmHg) = 4 times V squared, where V is the maximal velocity measured in meters/second. The main utility of this technique in the neonate is in estimating right ventricular systolic pressure from the velocity of a tricuspid regurgitant jet
Flow Volume Quantification
Flow volumes are calculated by defining the cross sectional area (CSA) of the vessel of interest and measuring the velocity of flow by Doppler method. In the case of pulsatile flow pattern, the velocity time integral (VTI) of the corresponding PW Doppler waveform is the area under a velocity time curve, and is equivalent to the stroke distance. Multiplying this by the cross sectional area of the vessel gives an estimate of stroke volume (SV).
In neonates estimates of flow volume are subject to significant variability, particularly from estimation of vessel diameters, which are then squared to estimate area (and any associated errors are also squared). Cardiac output is then the product of stroke volume and heart rate. Accuracy of these measurements is dependent on the quality of the 2D imaging, angle of insonation and beat to beat variability. Errors are minimized by optimization of image quality and averaging multiple measurements.
References
- Groves et al. Introduction to neonatologist-performed echocardiography. Pediatr Res. 2018 Jul;84(Suppl 1):1-12
- Nestaas et al. Tissue Doppler velocity imaging and event timings in neonates: a guide to image acquisition, measurement, interpretation, and reference values. Pediatr Res. 2018 Jul;84(Suppl 1):18-29
- Shriki. Ultrasound physics. Crit Care Clin. 2014 Jan;30(1):1-2
- Prabhu et al. Ultrasound Artifacts: Classification, Applied Physics With Illustrations, and Imaging Appearances. Crit Care Clin. 2014 Jan;30(1):1-2Ultrasound Quarterly. 30(2):145–157, 2014